Lab Ready Peptide Mass Spectrometry for Labs: 2–4 kV, 200–400 nl/min
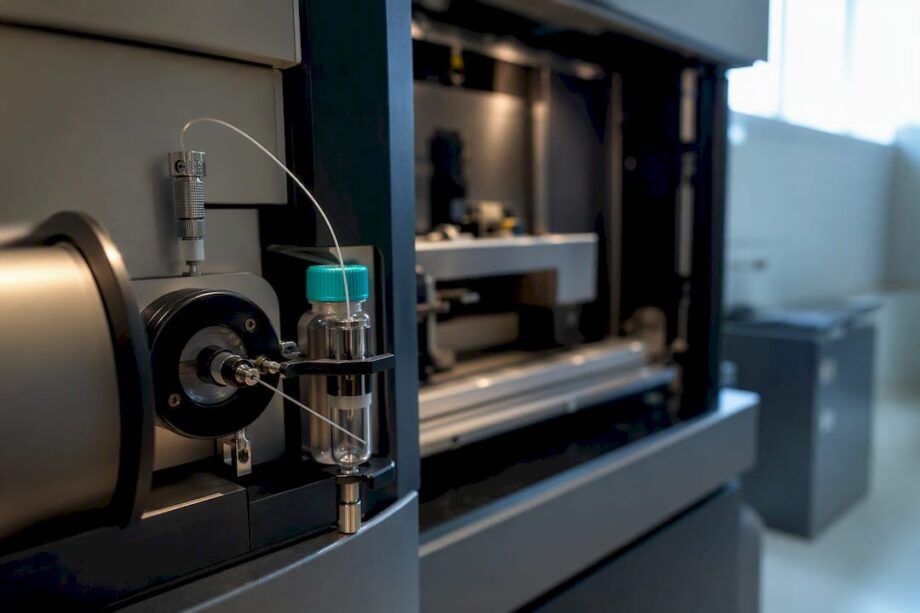
Mass spectrometry identifies and quantifies peptides by measuring the mass-to-charge ratio of intact peptide ions and their fragments, then matching those masses to sequence databases. Expect to work with ESI or MALDI sources, Orbitrap or TOF analyzers, and either DDA or DIA acquisition depending on whether you need discovery depth or reproducible quantification. The parameters below cover what actually changes your results.
TL;DR:
- High-resolution Orbitrap analyzers are essential for distinguishing modifications like deamidation or PTMs due to their superior mass accuracy.
- Sample preparation choices, such as digestion for bottom-up proteomics versus filtration for peptidomics, significantly influence data interpretation and biological insights.
- Ionization method selection, with ESI favored for LC-MS and MALDI for rapid fingerprinting, impacts sample complexity handling and sensitivity.
- Tandem MS fragmentation strategies, like CID/HCD or ETD/ECD, must match the modification of interest and the downstream database search for accurate identification.
- Regular instrument calibration, sample purity verification, and proper QC practices are critical for reliable peptide mass spectrometry results.
Table of Contents
- What Makes Peptide Mass Spectrometry Work
- Getting Peptides Ready for the Instrument
- Ionization and Fragmentation: Matching Method to Molecule
- Chromatography: Getting the Separation Right Before MS Even Sees the Sample
- Choosing Between DDA and DIA for Peptide Data Acquisition
- From Spectrum to Sequence: Identification and Software Considerations
- Where Peptide Mass Spectrometry Gets Used
- A Fast Checklist for Instrument and Sample Problems
- Why Peptide Purity Verification Changes Your Mass Spec Results
- Laboratory Lessons and Starter Parameters
- Another Way to Source COA-Verified Peptides for Your MS Work
- Sources
What Makes Peptide Mass Spectrometry Work
Every peptide MS measurement comes down to one number: mass-to-charge ratio, or m/z. A peptide ionized in the source picks up one or more protons, and the analyzer reports the mass of that charged species divided by its charge state, not the peptide’s actual molecular weight. A tryptic peptide carrying two protons shows up at roughly half the m/z you’d expect from its neutral mass. Get the charge state wrong during data interpretation and you’ll assign the wrong sequence entirely, which is a more common error in manual spectrum review than most people admit.
The analyzer you choose determines whether you can even see the difference between two similar peptides. Three types dominate peptide work, and each earns its place for different reasons:
- Quadrupole analyzers filter ions by m/z using oscillating electric fields. They’re fast and rugged but offer relatively low resolution, so they typically pair with another analyzer (as in a triple quadrupole or Q Exactive hybrid) rather than standing alone for peptide identification.
- Time-of-flight (TOF) analyzers measure how long an ion takes to travel a fixed distance. They offer good speed and decent resolution, making them a solid fit for high-throughput screening where you need answers fast more than you need to split hairs on mass accuracy.
- Orbitrap analyzers trap ions in an electrostatic field and measure their oscillation frequency, delivering the high resolution and mass accuracy that has made them a mainstream choice in peptide proteomics.
Resolution and mass accuracy matter most when you’re trying to tell apart peptides that sit almost on top of each other. A deamidation event shifts peptide mass by about 0.98 Da, close enough that a low-resolution instrument reads it as noise or a shoulder on the parent peak. An Orbitrap-class instrument resolves that difference cleanly, which is exactly why high-resolution platforms have become the default when PTM localization or isobaric peptide discrimination is the goal rather than a nice-to-have.
Getting Peptides Ready for the Instrument
Sample prep decisions made at the bench dictate what the instrument can and can’t tell you later. The two dominant workflows, bottom-up proteomics and peptidomics, diverge early and stay divergent.
Bottom-up preparation follows a fairly standard sequence:
- Lyse cells or tissue to release proteins, usually with a detergent or mechanical disruption method compatible with downstream digestion.
- Reduce disulfide bonds with DTT or TCEP, then alkylate free cysteines with iodoacetamide to prevent reformation.
- Digest with trypsin (occasionally Lys-C or a combination) to generate peptides with predictable cleavage sites at lysine and arginine.
- Desalt the digest, typically with C18 solid-phase extraction, to strip salts and detergents that suppress ionization.
Peptidomics skips step three entirely. Endogenous peptides, the ones your cells already made, carry biological information in their exact length and cleavage sites. Digesting the sample destroys that information, so peptidomics workflows rely on rapid heat or acid inactivation of proteases immediately after collection, followed by size-exclusion or molecular-weight cutoff filtration instead of enzymatic treatment.
Enrichment steps become necessary when your target is a small fraction of the total peptide pool. IMAC (immobilized metal affinity chromatography) pulls down phosphopeptides using metal ions like Fe3+ or Ti4+. TiO2 beads do something similar with different selectivity. Antibody-based capture works for specific PTMs, such as acetyl-lysine, where a generic chemical enrichment won’t cut it.
Pro Tip: Salt and detergent carryover is the single most common cause of poor ESI sensitivity in a new lab. If your peak intensities look flat and lifeless for no obvious reason, run a blank injection first. Ion suppression from residual SDS or Tris buffer masquerades as a bad instrument day far more often than actual instrument problems do.
Ionization and Fragmentation: Matching Method to Molecule
Electrospray ionization dominates LC-MS peptide analysis for a practical reason: it couples directly to liquid chromatography. A peptide-containing solvent stream passes through a capillary emitter held at roughly 2 to 4 kV, producing charged droplets that shrink into gas-phase peptide ions as solvent evaporates.
Voltage and flow rate, in practice: ESI emitter voltage sits in the 2 to 4 kV range for most nanoLC setups, and lower flow rates are known to improve ionization efficiency because smaller droplets form more readily at low flow. That’s the physical reason nanoLC beats analytical-flow HPLC for trace-level peptide detection.
MALDI takes a different path, embedding peptides in a crystalline matrix and firing a laser to generate ions directly from a solid surface. It handles complex mixtures with less chromatography and tolerates some contaminants ESI won’t, making it a workhorse for rapid peptide mass fingerprinting, though it typically pairs with TOF analyzers rather than the Orbitrap platforms common in LC-MS workflows.
Fragmentation method selection changes what you can see in the resulting MS/MS spectrum:
- CID/HCD (collision-induced or higher-energy collisional dissociation) breaks peptide backbones at amide bonds, producing b and y ions. It’s fast and works well for standard peptide identification but can strip labile PTMs like phosphorylation right off the backbone before you get useful sequence data.
- ETD/ECD (electron transfer or electron capture dissociation) fragments more gently, preserving labile modifications and producing c and z ions. This makes it the better choice when phosphorylation, glycosylation, or other fragile PTMs are the actual research question.
- EThcD, a hybrid approach, combines both to improve sequence coverage on larger or more heavily modified peptides.
Match your fragmentation choice to your downstream search strategy before you run the sample, not after. A database search tuned for b/y ions won’t score c/z fragment spectra well, and mismatched settings are a quiet, common source of missed identifications.
Chromatography: Getting the Separation Right Before MS Even Sees the Sample
Flow rate is the first decision, and it shapes everything downstream. NanoLC, running at roughly 200 to 400 nanoliters per minute, delivers the best sensitivity for limited or precious samples because low flow rates concentrate the peptide signal into a smaller ESI plume. Microflow (a few microliters per minute) trades some sensitivity for better retention time reproducibility and less column clogging, useful in high-throughput clinical or quantitative pipelines. Analytical flow rates, in the hundreds of microliters per minute, sacrifice sensitivity almost entirely but tolerate dirtier samples and higher loading amounts.
Column choice follows from the same logic:
- A 15 to 25 cm C18 reversed-phase column with 1.7 to 3 micron particles handles most standard bottom-up runs.
- Longer columns (25 to 50 cm) and shallower gradients (90 to 180 minutes) improve peptide separation for deep proteome coverage, at the cost of instrument time.
- Short columns and steep gradients (20 to 40 minutes) suit targeted or high-throughput screening where depth matters less than speed.
Fractionation earns its place when a single LC-MS run can’t resolve enough peptides to cover a complex proteome. Basic reversed-phase fractionation at high pH, splitting a digest into 8 to 12 fractions before a second low-pH separation, is a straightforward way to roughly double identification numbers on complex samples without switching instruments.
Choosing Between DDA and DIA for Peptide Data Acquisition
Data-dependent acquisition (DDA) selects the most intense precursor ions in real time and fragments them one at a time. It’s the traditional discovery workflow, good at generating deep, flexible datasets, but it suffers from stochastic sampling. Run the same sample twice and you won’t get identical peptide lists, because the instrument’s real-time selection logic makes slightly different choices each run.
Data-independent acquisition (DIA) fragments all precursors within defined m/z windows regardless of intensity, systematically, every run. That trades some flexibility for reproducibility, which matters enormously in quantitative studies across many samples where consistent peptide detection across a cohort is the entire point.
Quantification strategy is a separate decision from acquisition mode:
- Label-free quantification compares peak intensities or spectral counts across separately run samples. It’s the cheapest and most flexible option but demands tight chromatographic reproducibility to avoid comparing apples to oranges.
- SILAC (stable isotope labeling with amino acids in cell culture) metabolically labels cells before mixing, so labeled and unlabeled peptides run in the same injection and compare directly. It’s limited to systems where you control the growth media, which rules out most clinical tissue.
- TMT (tandem mass tags) chemically labels peptides after digestion with isobaric tags, allowing up to 18 samples to be multiplexed into a single LC-MS run, which cuts instrument time dramatically for large cohort studies.
Starting instrument settings worth knowing before you touch the method editor: isolation windows of 1.2 to 2 Da for DDA, cycle times under 3 seconds to keep pace with chromatographic peak widths, and MS1 resolution around 60,000 to 120,000 with MS2 resolution around 15,000 to 30,000 on Orbitrap platforms. Tighter isolation windows improve selectivity but cost sensitivity on lower-abundance precursors.
From Spectrum to Sequence: Identification and Software Considerations
Database searching remains the backbone of peptide identification. The software digests a reference proteome in silico, predicts theoretical fragment spectra for each candidate peptide, and scores those predictions against your actual MS/MS data to find the best match.
False discovery rate control is not optional. Skip this step, or run a search without decoys, and you’re reporting identifications with no honest measure of how many are wrong.
A few things separate a clean workflow from a shaky one:
- Library-based DIA search strategies use a pre-built spectral library from prior DDA runs, improving sensitivity but requiring that library to actually represent your sample type.
- Library-free DIA searches directly against a predicted or in silico spectral library, more flexible but sometimes less sensitive for unusual sample types.
- De novo sequencing, inferring sequence directly from fragment mass differences without a database, matters for peptides absent from any reference proteome, though it carries higher error rates than database matching.
- PTM localization scoring (tools like AScore or similar site-determination algorithms) is essential whenever a modification could sit on more than one residue in a peptide, since a high-confidence peptide ID with an ambiguous PTM site is only half an answer.
Pro Tip: *Before reporting any identification, check for consistent detection across biological replicates and confirm the spectral match visually for anything driving a key conclusion.
Where Peptide Mass Spectrometry Gets Used
Peptidomics and bottom-up proteomics answer different biological questions, and that difference starts at the bench. Peptidomics captures endogenous peptides as biology made them, preserving exact cleavage sites that carry functional meaning, such as distinguishing an active hormone fragment from an inactive precursor. Bottom-up proteomics deliberately erases that information through digestion to maximize protein coverage instead.
PTM mapping studies typically pair ETD or EThcD fragmentation with IMAC or TiO2 enrichment when phosphorylation is the target, since gentle fragmentation preserves the modification long enough to localize it. Glycosylation studies often add specific glycosidase treatments before MS to simplify the resulting spectra.
Quantitative peptide studies live or die on experimental design decisions made well before the instrument runs:
- Include at least three biological replicates per condition to distinguish real change from normal variability.
- Spike in a known quantity of a synthetic peptide standard to normalize across runs and catch systematic drift.
- Randomize injection order across conditions to avoid confusing a time-dependent instrument drift with a true biological effect.
A Fast Checklist for Instrument and Sample Problems
Low identification numbers and messy chromatograms almost always trace back to one of a handful of causes, and working through them in order saves time.
- Check mass calibration first. A drifting calibration silently degrades every downstream ID; run a calibration standard and confirm mass accuracy is within the manufacturer’s stated tolerance before troubleshooting anything else.
- Look for contamination. Polymer peaks (from plastic tubes or pipette tips), keratin (from skin or hair), and detergent carryover are the usual suspects behind a mysterious drop in sensitivity.
- Inspect the chromatogram directly. Peak tailing usually points to a degraded column or a dead volume issue in the fittings; software that handles automated peak deconvolution can help pull a clean quantitative signal out of overlapping or poorly resolved peaks.
- Rerun sample prep from an earlier step if digestion efficiency looks incomplete (missed cleavages showing up in unusually high numbers) rather than trying to compensate for it in the search parameters.
Pro Tip: Keep a reference peptide mix on hand purely for instrument QC, run it at the start of every session, and log retention time and peak shape over time. A slow creep in retention time is often the earliest warning sign of a column that needs replacing, well before it shows up as a drop in identification numbers.
Why Peptide Purity Verification Changes Your Mass Spec Results
A contaminated or misidentified starting peptide poisons every downstream measurement, and it’s a more common failure point than most published methods sections acknowledge.
That’s the practical reason an independent Certificate of Analysis matters more than a supplier’s word. When you’re sourcing a peptide to use as an internal standard or spike-in for quantitative MS work, request:
- The actual HPLC trace, not just a summary purity percentage.
- Batch-specific testing rather than a generic product-line certificate.
- Mass confirmation data alongside the purity figure, since a peptide can be chemically pure and still be the wrong mass if a synthesis error occurred.
Peptelia’s quality testing documentation lays out exactly what gets verified before a batch ships, which matters when a reviewer eventually asks how you know your standard was what the label claimed.
Laboratory Lessons and Starter Parameters
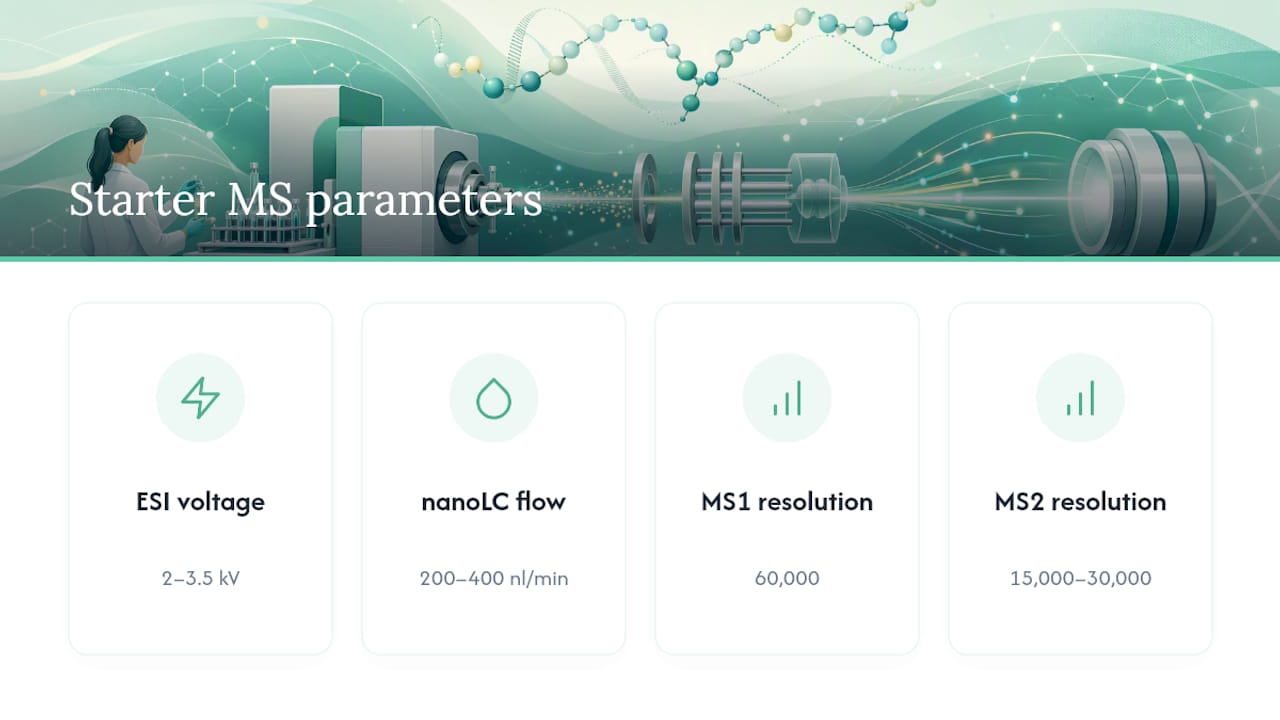
If you’re setting up a new peptide MS method, start with ESI voltage around 2 to 3.5 kV and nanoLC flow around 200 to 400 nl/min. Set MS1 resolution to 60,000 and MS2 resolution to 15,000 to 30,000 as a reasonable default, then adjust based on what your specific peptides demand.
Three habits pay off more than any single parameter tweak. Run a QC standard at the start of every batch, not just when something already looks wrong. Keep a running log of retention times for a fixed reference peptide so drift shows up before it wrecks a full experiment. And never trust a purity number you can’t trace back to an actual chromatogram.
Plan the acquisition strategy, DDA or DIA, and the fragmentation method before you touch the sample prep bench, because those downstream choices should shape how you enrich and digest, not the other way around.
— Max
Another Way to Source COA-Verified Peptides for Your MS Work
If you’re building a quantification standard curve or need a clean reference peptide for method validation, sourcing reliable starting material matters as much as instrument settings.

That documentation matters directly for MS work: a verified reference standard removes one entire category of ambiguity when you’re troubleshooting whether a weird peak is a real biological signal or a contaminated starting reagent. Peptelia ships from Europe with the batch-specific COA and HPLC data available for products including SELANK and TB-500. Browse the full catalog to check purity documentation on the specific peptide your study requires before you place an order.
Sources
- A beginner’s guide to mass spectrometry–based proteomics
- Identifying and Measuring Endogenous Peptides through Peptidomics