Don’t Assume 99% Peptide Purity: How Labs Convert COAs into Doses
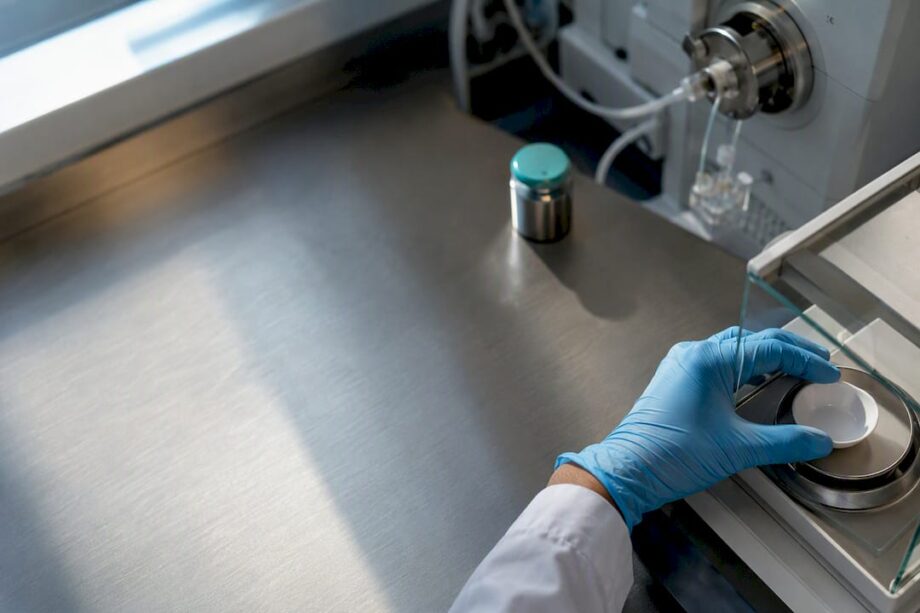
The actual peptide content, or net peptide content, is frequently lower once you account for trifluoroacetate salts, residual water, and buffer components. Before trusting the number, ask for two things: the full HPLC chromatogram and a mass spectrometry identity report.
TL;DR:
- High HPLC purity does not guarantee the actual peptide mass; residual salts, moisture, and TFA salts can account for up to 40% of the total weight.
- Confirm peptide identity with mass spectrometry data and full chromatograms, as a single purity percentage lacks sufficient verification, especially across vendors.
- A small percentage of impurities typically includes truncated sequences, oxidized or deamidated variants, residual salts, solvents, and endotoxin, which can impact specific assays differently.
- For accurate dosing, use the net peptide content percentage rather than the HPLC purity figure, accounting for all non-peptide impurities that inflate the label weight.
- Suppliers that provide complete, verifiable COAs with chromatogram and mass spec data ensure data accuracy and reliability, unlike those offering only unverified purity claims.
Table of Contents
- What “peptide purity 99%” actually measures: area percent vs. absolute content
- How labs measure it: reversed-phase HPLC and mass spec confirmation
- The impurities hiding in that last 1%
- When you actually need 99% purity, and when you don’t
- Converting purity numbers into actual doses: NPC calculations
- What a real COA should show, and the questions to send a vendor
- How Peptélia verifies every batch
- Ordering COA-verified peptides for your next study
- A lab supplier’s take on purity claims
- Sources
What “peptide purity 99%” actually measures: area percent vs. absolute content
Most vendors report chromatographic purity, calculated as the integrated area of the main peak divided by the total integrated area under the UV trace. It is a proportional measurement of the sample relative to everything else that eluted during a reversed-phase HPLC run. It tells you almost nothing about what fraction of the vial’s dry mass is actually peptide.
That second figure has a name: net peptide content (NPC), sometimes called absolute peptide content. It is measured by amino acid analysis (AAA) or nitrogen analysis rather than chromatography, and it accounts for everything the HPLC trace doesn’t separate out, mainly counterions, moisture, and inorganic salts. For TFA-salt peptides, residual trifluoroacetate can run 10 to 40% of the total mass in sequences with several basic residues like arginine or lysine.
TFA doesn’t wash out during freeze-drying. It’s ionically bound to basic side chains, and it stays there through lyophilization. Removing it requires a deliberate counterion exchange, swapping to acetate or hydrochloride salt through a separate desalting or ion-exchange step, which is why converted-salt peptides often cost more.
What this means for your bench work:
- A high HPLC number confirms the sample is chemically clean relative to synthesis byproducts.
- It does not confirm how much peptide mass you’re actually weighing into a tube.
- For any assay where concentration matters, you need the NPC figure, not just the area percent, to calculate an accurate stock solution.
How labs measure it: reversed-phase HPLC and mass spec confirmation
The purity number on a certificate of analysis comes from a defined analytical sequence, and each step has parameters that shift the final result.
- Reversed-phase HPLC separation. The peptide sample runs through a C18 (or occasionally C8) column under a gradient of water and acetonitrile, typically with 0.1% TFA as an ion-pairing agent. Detection happens at 214 nm, the wavelength that captures peptide bond absorbance, sometimes paired with a 280 nm channel if the sequence contains aromatic residues like tryptophan or tyrosine.
- Area-percent integration. Software integrates every peak above a set threshold and calculates the main peak’s share of the total. Baseline construction, integration threshold, and total run length all change the outcome. A method that cuts the run short before late-eluting impurities elute will report a higher purity than a longer, more complete run would show.
- Mass spectrometry identity confirmation. MS, usually electrospray ionization time-of-flight or MALDI, confirms that the main peak’s molecular weight matches the expected sequence. It’s an identity check, not a quantitative purity check, and it has its own blind spots: isotope clusters, sodium or potassium adducts, and instrument resolution can all complicate interpretation for larger peptides.
A COA that only lists a number without method detail is not giving you enough to evaluate the claim. Look for the column type, solvent system, gradient profile, total run time, detection wavelength, and integration parameters. Thermo Fisher’s custom synthesis documentation treats HPLC-plus-MS as the baseline QC pairing for research-grade peptide products, and that pairing has become the working standard across the industry.
One caution worth repeating to a lab manager: two vendors can run the same peptide through HPLC and report different area-percent values, purely because of integration settings. A percentage without a method behind it is close to meaningless for comparison purposes.

The impurities hiding in that last 1%
The 1% (or more, once NPC enters the picture) isn’t a single contaminant. It’s usually a mix of several impurity classes, and which ones dominate matters for how much risk they pose to a given experiment.
- Truncated or deletion sequences. Incomplete coupling during solid-phase synthesis leaves shorter fragments missing one or more residues. These often share retention characteristics close to the full-length peptide, making them hard to fully resolve.
- Oxidized, deamidated, or racemized variants. Methionine and cysteine residues oxidize readily; asparagine and glutamine deamidate over time or under heat. Racemization during synthesis flips a residue’s stereochemistry, which can quietly kill receptor binding without changing the molecular weight MS reports.
- Residual salts and counterions. TFA and acetate are the most common, sitting outside the peptide backbone but adding to the total sample mass.
- Residual solvents and endotoxin. Acetonitrile, DMF, and DMSO traces from synthesis and purification, plus bacterial endotoxin picked up during processing or handling, are impurities that HPLC purity checks don’t catch at all. Peptides have been documented passing HPLC purity screens while still exceeding endotoxin thresholds, which is exactly why endotoxin testing sits in a separate category from purity testing.
For binding assays and enzymology, truncated variants are usually the bigger concern because they can act as weak competitive inhibitors that muddy your dose response curve. For cell-based work, endotoxin contamination is the one to watch, since even trace amounts can trigger inflammatory signaling that has nothing to do with your peptide of interest.
Pro Tip: If your assay involves immune cells, macrophages, or any inflammation-sensitive readout, request an endotoxin certificate separately. HPLC purity and endotoxin load are measured by completely different methods, and a clean chromatogram tells you nothing about lipopolysaccharide contamination.
When you actually need 99% purity, and when you don’t
Purity requirements should track your assay’s sensitivity to interference, not a blanket preference for the highest number available. Chasing 99.5% for a screening assay where 95% would perform identically is money spent on a variable that doesn’t change your result.
- ≥99% purity: mechanistic studies, potency curves intended for publication, and any dose-response work where a small shift in EC50 or IC50 would be scientifically meaningful.
- ≥98% purity: most receptor-binding assays and standard cell-based work, where trace truncated variants are unlikely to shift the outcome measurably.
- 95 to 98% purity: early screening, feasibility work, and internal exploratory studies where you’re deciding whether a peptide deserves further investment.
Beyond a certain point, higher purity buys diminishing returns relative to cost. Spend the extra money on the test that actually reduces uncertainty in your specific assay, not on a marginal purity bump you can’t detect in your results anyway.
Converting purity numbers into actual doses: NPC calculations
This is where a lot of dosing errors quietly creep into published data.
Net peptide content typically runs 60 to 90% for TFA-salt peptides, depending on how many basic residues the sequence carries. Here’s how that plays out numerically:
- Start with a vial labeled 1 mg, 98% HPLC purity.
- Check the COA for net peptide content. If NPC is listed at 75%, that vial contains approximately 0.74 mg of actual peptide, not 0.98 mg.
- The remaining roughly 0.20 mg to 0.24 mg is TFA salt and moisture, not peptide mass at all.
- To make a stock solution at a target concentration, use the 0.74 mg figure in your calculation, not the label weight and not the HPLC percentage.
- Recalculate your dilution series from that corrected mass before running the assay.
Skip step 2 and 3, and every concentration in your dose-response curve carries the same systematic error. That’s not random noise you can average out across replicates. It’s a consistent offset that shifts your entire curve, and it’s exactly the kind of error that shows up as an unexplained discrepancy when someone tries to replicate your published EC50 later.
Common dosing errors worth checking against before you start:
- Using label weight instead of NPC-adjusted weight for stock calculations.
- Assuming HPLC area percent and net peptide content are the same number.
- Skipping a fresh NPC check after switching vendors, since NPC varies by sequence and synthesis batch.
- Not correcting for water content when the peptide is hygroscopic and has been open to air.
What a real COA should show, and the questions to send a vendor
A certificate of analysis is only useful if it gives you enough to verify the claim yourself, not just a number to take on faith.
At minimum, a COA worth trusting includes a full chromatogram image (not a cropped or truncated trace), the HPLC method parameters, a mass spectrum confirming molecular identity, the method used to determine peptide content, and an endotoxin result if the peptide is intended for cell-based work.
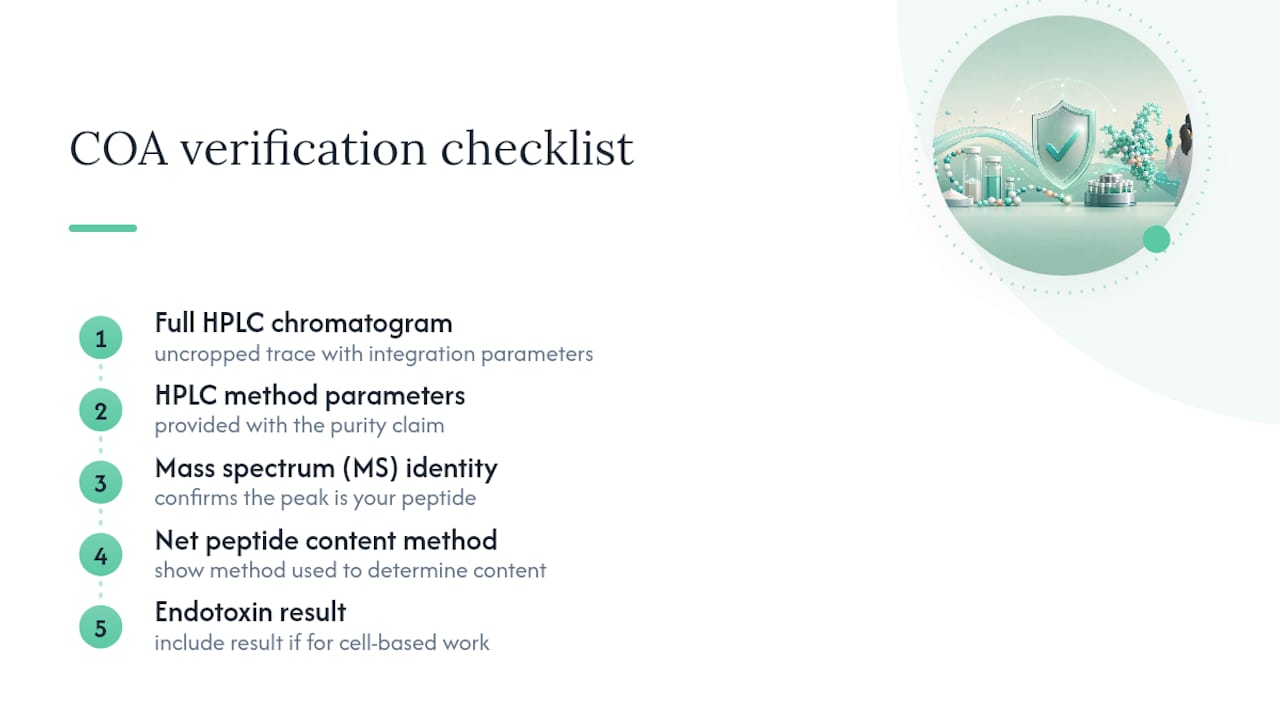
Red flags to watch for: a COA with no chromatogram image, purity stated with no method parameters attached, or an area-percent number with no accompanying MS data confirming the peak is actually the peptide you ordered. Independent lab testing has found 43% of peptides sent for third-party verification failed to meet their labeled purity claims, with some lower-tier suppliers advertising 99%+ while independent testing measured actual purity in the 71 to 91% range. That gap is exactly why a document you can verify matters more than a number you’re asked to trust.
Pro Tip: Send this exact request to any vendor before ordering: “Please provide the full HPLC chromatogram with integration parameters, the MS spectrum confirming identity, the net peptide content method used, and endotoxin data if available.” A vendor with legitimate testing infrastructure will have these on file already.
How Peptélia verifies every batch
Independent HPLC testing on every batch and issuance of a certificate of analysis with a full chromatogram for each product sold, rather than a single summary percentage, is a recommended best practice. That practice reflects the exact verification standard laid out above: a document a researcher can actually check, not just a claim to accept.
Products like GHK-Cu, SEMAX, and TB-500 each carry their own COA-verified testing documentation, viewable through Peptélia’s product-quality testing page. For a researcher deciding between vendors, that’s the difference between reading a number and reading the data behind it.
Ordering COA-verified peptides for your next study
If you’ve read this far, you already know the gap between a purity claim and a verifiable one. Peptélia closes that gap by shipping every batch with an independent COA that includes the full chromatogram and mass spectrometry confirmation, so you’re not taking a supplier’s word for what’s in the vial.

Every product page lists its own testing documentation, and the product-quality testing page breaks down the HPLC and MS methods behind each certificate. For neurocognitive research, SEMAX and SELANK are both available with full COA documentation, and regenerative research applications are covered by products like TB-500 and GHK-Cu. Orders ship from Europe with lab-focused support available if you have batch-specific questions before you commit budget to a study.
Start by checking the COA on the peptide you need, then place your order through the Peptélia shop with the documentation already in hand.
A lab supplier’s take on purity claims
Treat a bare purity percentage the way you’d treat an unreferenced claim in a manuscript: interesting, but not something to build a result on until you’ve checked the source. Look for the chromatogram and the mass spec data before you look at the number attached to them. Use net peptide content, not the HPLC figure, whenever you’re calculating an actual dose or stock concentration, because that’s the number that determines whether your dilution series is accurate or systematically off. If your assay is endotoxin-sensitive, ask for that data as its own line item, since no purity method covers it. None of this is complicated once you know to ask for it. It just requires asking before the order ships, not after the data doesn’t replicate.
— Max
Sources
- Peptide Purity: What Your COA Numbers Mean | Peptide Grades
- Custom Peptide Synthesis Services | Thermo Fisher Scientific – US